50 Hours Synchronous Learning / 16 Hours Online Learning / Schedule Varies / Instructor Led
Course Offerings
Enrollment requests submitted later than one week prior to a course launch date are subject to approval. Advertised dates do not reflect available slots in a cohort.
Sessions:
Nov 3, 2025 – Dec 15, 2025
Time:
7 pm – 10 pm ET
6 pm – 9 pm CT
4 pm – 7 pm PT
Tuition Includes:
Official CompTIA Materials
Official CompTIA Live Labs
Official CompTIA Practice Certification Exam
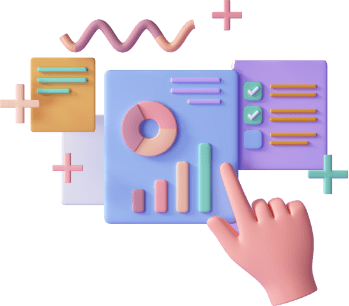
Upon course completion, students will be able to do the following:
- Identify basic concepts of data schemas
- Understand different data systems
- Understand types and characteristics of data
- Compare and contrast different data structures, formats, and markup languages
- Explain data integration and collection methods
- Identify common reasons for cleansing and profiling data
- Execute different data manipulation techniques
- Explain common techniques for data manipulation and optimization
- Apply descriptive statistical methods
- Describe key analysis techniques
- Understand the use of different statistical methods
- Use the appropriate type of visualization
- Express business requirements in a report format
- Design components for reports and dashboards
- Distinguish different report types
- Summarize the importance of data governance
- Apply quality control to data
- Explain master data management concepts
- Identify common data analytics tools
Course Outline:
Lesson 1: Identifying Basic Concepts of Data Schemas
Data analysts work with data, and often that data is stored in a database. This is why it is of the utmost importance that you understand the basic foundations of databases. For example, the type of database you’re working with can alter your decision-making as a data analyst, so it is crucial that you have a solid understanding of what differentiates relational from non-relational databases. Further, understanding how the tables in a relational database are designed and how the fields interact with each other will help you build necessary sets for analysis.
Lesson 2: Understanding Different Data Systems
Learning about common types of database processing and storage systems will help you understand the different types of structures and schemas you will encounter in your work as a data analyst. You don’t have to know everything about all of these data systems, as they are controlled by other data roles in an organization. However, you will be accessing data stored and/or processed with these technologies.
Lesson 3: Understanding Types and Characteristics of Data
As data analysts, we must be able to identify the types of data we are working with, as this controls what we can do with the data. At the start of a project, our first goal is to determine the type of data at a high level. Then we approach the data at the most granular level, which is the field data type. We also must be able to control the data type to meet the needs of our analysis. The better you understand the different types and characteristics of data, the better you can approach each data set you work with.
Lesson 4: Comparing and Contrasting Different Data Structures, Formats, and Markup Languages
Data can either be structured or unstructured. How we interact with that data varies: it might be through direct connections to the data or through exports of varying file formats. We will also likely encounter and work with data that has been marked up with different languages and standards, like XML and JSON. It is important to understand that the way we work with data is typically dictated by the way the data was designed.
Lesson 5: Explaining Data Integration and Collection Methods
When data is created through the various systems of an organization, there is a need for processes that help transform data to make it more meaningful and ensure the data meets any requirements. Extract, Transform, Load (ETL) and Extract, Load, Transform (ELT) processes make our data consistent. Not all data changes occur in real time, so understanding how data goes from its natural state to the state where it can be loaded into a database or data warehouse is valuable for the analyst. The creation of application programming interface (API) and web scraping is traditionally in the domain knowledge of software developers, but knowing how different data is collected and passed through systems, and when this occurs, can provide valuable insight to the analyst for their own reporting. Further, the analyst should understand how public data and survey data are collected and used.
Lesson 6: Identifying Common Reasons for Cleansing and Profiling Data
Rapid changes in business practices and business requirements are the main reasons we encounter less-than-perfect data sets or data structures in our work, leading to the need for cleansing and profiling data. Data sets that have a poor design or are attempting to retrofit a process into an off-the-shelf software also often need to be cleaned or profiled. When a company designs a system or process for handling their data, they base it on what they know in that moment. If you have ever heard the saying, “flying the plane while building it,” that is a fair description of how many organizations approach building data-centric systems. Once you know the types of imperfections data systems may have, you can start handling these common issues.
Lesson 7: Executing Different Data Manipulation Techniques
When we encounter a data set that is not meaningful, we must replace the values with more readable information. Data analysts regularly recode data for better analysis and more meaningful reports. We use strategies like deriving variables and imputing values when we encounter a need for data that is not in our data set. These different techniques allow us to create new values from data that is available. On the other hand, sometimes we have more data than we need for our analysis and can leverage aggregation or sampling to focus only on the values we need for further analysis. We will likely discover a need to join data sets from multiple sources and must understand the impact of joins when we query data.
Lesson 8: Explaining Common Techniques for Data Manipulation and Optimization
A common misconception that data professionals have is that they will be working with clean data of the appropriate data type, and that all of the data they need will exist in the data set. However, having data that is clean and ready for analysis rarely happens, especially when dealing with legacy systems (older technology). However, even when using modern software, there will always be an opportunity to clean and manipulate data to better suit your needs.
Lesson 9: Applying Descriptive Statistical Methods
The work of a data analyst involves summarizing overall findings and insights after analyzing the data. Data analysts describe data in conversations and presentations, and thus learning how to describe the data through various methods (e.g., averages of data, range of data) is a necessary part of the analyst’s role. Data analysis also draws conclusions about the distribution of data and may show these findings visually in many workplace scenarios.
At the beginning of a project, descriptive statistical methods are invaluable for understanding your data and finding issues that need to be addressed. Understanding how to describe your data will help you to either be confident in the accuracy and quality of the data, or speak to a lack of confidence in the data, depending on what your analysis reveals.
Lesson 10: Describing Key Analysis Techniques
When you are preparing to work with data, you must first determine what you are researching, where the data comes from, and what types of analysis you wish to perform. You will likely approach all data sets in this same manner, regardless of which type of analysis you end up conducting. Analysis can range from exploratory, which is performed at a high level and applicable to all data sets, to other types that are more specific to the goal and outcome of the research. Thus, it is important that you understand how to create a research question and identify the source of data before moving on to the actual analysis.
Lesson 11: Understanding the Use of Different Statistical Methods
Inferential statistics involves reaching conclusions based on evidence and reasoning using data, and includes methods such as confidence intervals, t-tests, and hypothesis testing. Using inferential statistics on both large and small sample sizes allows us to create findings for just about anything that we can gather data on and measure. With inferential statistics, we can analyze data gathered about programs, people, things, and even interventions. This differs from descriptive analysis, which just aims to describe the data we are using to draw conclusions. Inferential statistics also allow us to utilize smaller samples to represent a larger population. We use different statistical tests to determine the statistical significance of our findings, leveraging p-values.
Lesson 12: Using the Appropriate Type of Visualization
After you analyze your data, you may realize that the information can be more easily digested if you can present it visually. When data lends itself to visualization, you must first figure out which type of visualization is best suited for your data. Learning about data visualization is really centered on learning how to effectively share insight with visuals. It could be that basic visuals are all you need to make a point. In other cases, you might require advanced visuals in order to bring certain issues to light. You might even need to map data. When deciding what visual you’ll use, it’s in your best interest to consider how a certain type of visualization is intended to be used alongside the story your data needs to tell.
Lesson 13: Expressing Business Requirements in a Report Format
A key skill for the data analyst is the ability to translate information into business requirements. Developing business requirements in the data world means that, as an analyst, you understand the types of requirements needed to perform any business request that comes your way. You must then work through those requirements to deliver the appropriate style of report or dashboard, with the correct type of filters, and at the right time to the right people. From the outset, a data analyst must develop a high-level understanding of the audience for the data, where the data came from, and how it will be delivered. This information will guide you in designing reports and dashboards that meet requirements and have the appropriate view filters and navigation. Understanding and outlining the requirements for data helps to ensure that reporting not only meets specification, but that it is also usable by the people who need the information.
Lesson 14: Designing Components for Reports and Dashboards
When developing reports and dashboards as a data analyst, you must consider not only how to make the data meaningful for what you are reporting on for the organization, but also in accordance with the organization’s style. Your audience will desire a great user experience, so reports and dashboards must be designed with this in mind. Using proper colors, knowing the needs of your audience, and following the company style guide are all important parts of the process. Everything must be considered right down to the font style and size used for the data. You also mustn’t forget to include key elements, like the refresh date, and the narrative and key talking points, so you can be sure your report conveys what the data is truly saying. You should also provide answers for the questions your audience may have and include critical supporting information that not only helps them, but also helps you move on to the next task at hand.
Lesson 15: Distinguishing Different Report Types
As an analyst, you will discover that there are differences in the types of reports you may create. Some will be static, and some will be dynamic. This designation refers to the way that the data refreshes, and what this means for the data analyst is either the audience will serve themselves from the dashboard you created, or you will update your reports and provide them a static copy. You will also receive one-time requests, which is referred to as ad-hoc reporting. You may find that these requests can sometimes lead to regular reporting for the organization. Whether fulfilling a one-time request or running a routine report, you will also need to consider the timing of the reporting, whether it covers a specified period of time or just a point in time.
Lesson 16: Summarizing the Importance of Data Governance
When a company adopts a data governance plan, it involves the people, processes, and technology needed to control data. Data governance aims to ensure that data maintains its quality and integrity by establishing definitions, rules, and standardization. Data governance also allows for the organization to adhere to regulations and helps maintain compliance. Data governance impacts the quality of data in a very positive way for the data analyst, as it sets the rules of the data from the top level to all levels of the organization.
Lesson 17: Applying Quality Control to Data
Have you ever heard the phrase “garbage in, garbage out”? In the world of data analysis, the use of proper data validation methods can turn some of that “garbage in” into “one person’s trash is another’s person’s treasure.” Quality data leads to quality reporting. A report would be problematic if the data was inaccurate, incomplete, or inconsistent. In this lesson, we will describe the quality assurance process and explain the reasons we check for data quality. We will learn how to understand data quality metrics and walk through different methods to verify and validate the data that we provide for reporting.
Lesson 18: Explaining Master Data Management Concepts
Master data management is key to data quality, as it enables the existence of a single source of truth at an organization. Master data management at large organizations with compliance regulations is traditionally supported through data governance and the use of dedicated software.
Appendix A: Identifying Common Data Analytics Tools
All necessary course materials are included.
Certification(s):
This course prepares a studednt to take the CompTIA Data+ DA0-001 national certification exam.